|
"Fisheries have rarely been 'sustainable'. Rather, fishing has induced serial depletions, long masked by improved technology, geographic expansion and exploitation of previously spurned species lower in the food web." This quote is from an article on Nature written by Daniel Pauly, Villy Christensen, Sylvie Guénette, Tony J. Pitcher, U. Rashid Sumaila, Carl J. Walters, R. Watson & Dirk Zeller. This article writes about how are oceans are being depleted due to overfishing of the aquatic wildlife and how our current level of fishing can not be sustained. The below graph is from the article and shows the averages catches of different aquatic life measured in million tonnes per year. 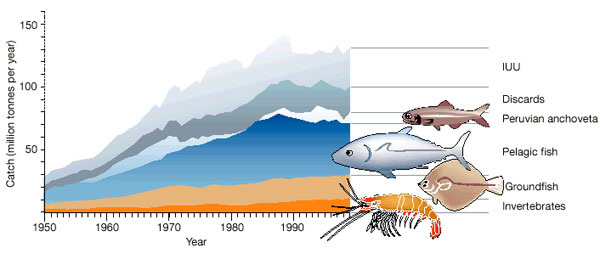 "The trend of this graph clearly shows that the catch per year measured in million tonnes of each aquatic group represented in this graph and the fish caught illegally (IUU) and the fish that is discarded, have been on the rise since 1950.
As for the validity of this data on this graph, the article states that "Figures for invertebrates, groundfish, pelagic fish and Peruvian anchoveta are from FAO catch statistics, with adjustment for over-reporting from China. Fish caught but then discarded were not included in the FAO landings; data relate to the early 1990s were made proportional to the FAO landings for other periods. Other illegal, unreported or unregulated (IUU) catches were estimated by identifying, for each 5-year block, the dominant jurisdiction and gear use (and hence incentive for IUU); reported catches were then raised by the percentage of IUU in major fisheries for each 5-year block. The resulting estimates of IUU are very tentative (note dotted y-axis), and we consider that complementing landings statistics with more reliable estimates of discards and IUU is crucial for a transition to ecosystem-based management." This level of detail in how they collected their data helped to limit the extraneous variables, increasing the reliability of the data portrayed on this graph. However it is of course almost impossible for all the world's fishing to be taken into account, especially the illegal fishing (IUU) which as mentioned was just estimated and inferred from looking at the dominant jurisdiction and gear used. This means that especially for the illegal fishing section of this graph there could be a large percentage error. Article: "Towards sustainability in world fisheries" http://www.nature.com/nature/journal/v418/n6898/full/nature01017.html
0 Comments
Discuss, giving named examples, the difficulties of placing organisms in higher trophic levels.17/5/2016 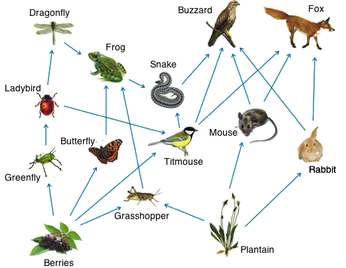 Above we have an example of a food web. This food web shows the transfer of energy through what eats what in a particular environment. Each organism on this food web is defined into a trophic level depending on how high up the food web it is, for example the Plantain is an example of a producer, the rabbit is an example of a primary consumer and the Fox is an example of a secondary consumer. However organisms tend to have very varied diets to aid survival and therefore can end up on more than one trophic level. For example the frog can be classes as a secondary consumer as it eats the butterfly (primary consumer) which eats the berries (producer) the frog however can also be classified as a quaternary consumer as, as well as eating butterflies, the frog also eats dragonflies which are tertiary consumers (They eat ladybirds, which eat greenflies which eat berries). Example like the frog in this food web are very common and make it very hard for ecologists studying these community interactions to place organisms on distinct trophic levels as they often rest on more than one trophic level.
Population:A population is a group of organism of one species that live in the same habitat and interbreed with each other frequently.  Community:A community is an assemblage of the populations of two or more different species occupying the same habitat at the same time. When you study a community you look at the different interactions between the separate populations.  |
Jack BojanArdingly College Archives
March 2017
|
 RSS Feed
